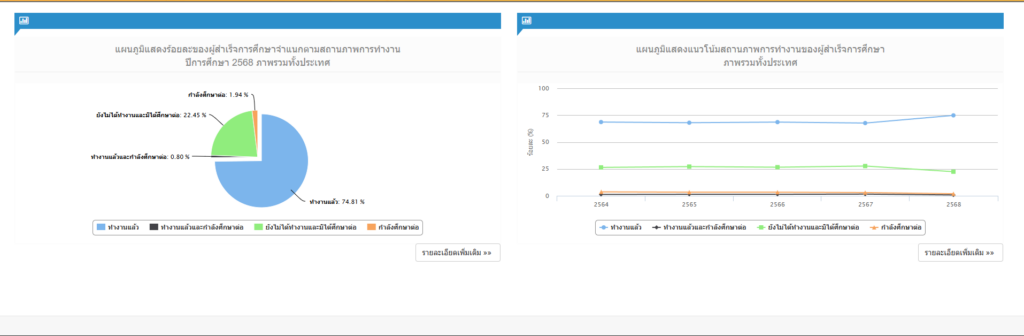
The figures present the national employment status of higher education graduates for Academic Year 2568 (2025) and the employment trends from Academic Years 2564–2568 (2021–2025).
Overall, the employment outcomes of graduates remain positive, with employment continuing to be the primary post-graduation destination.
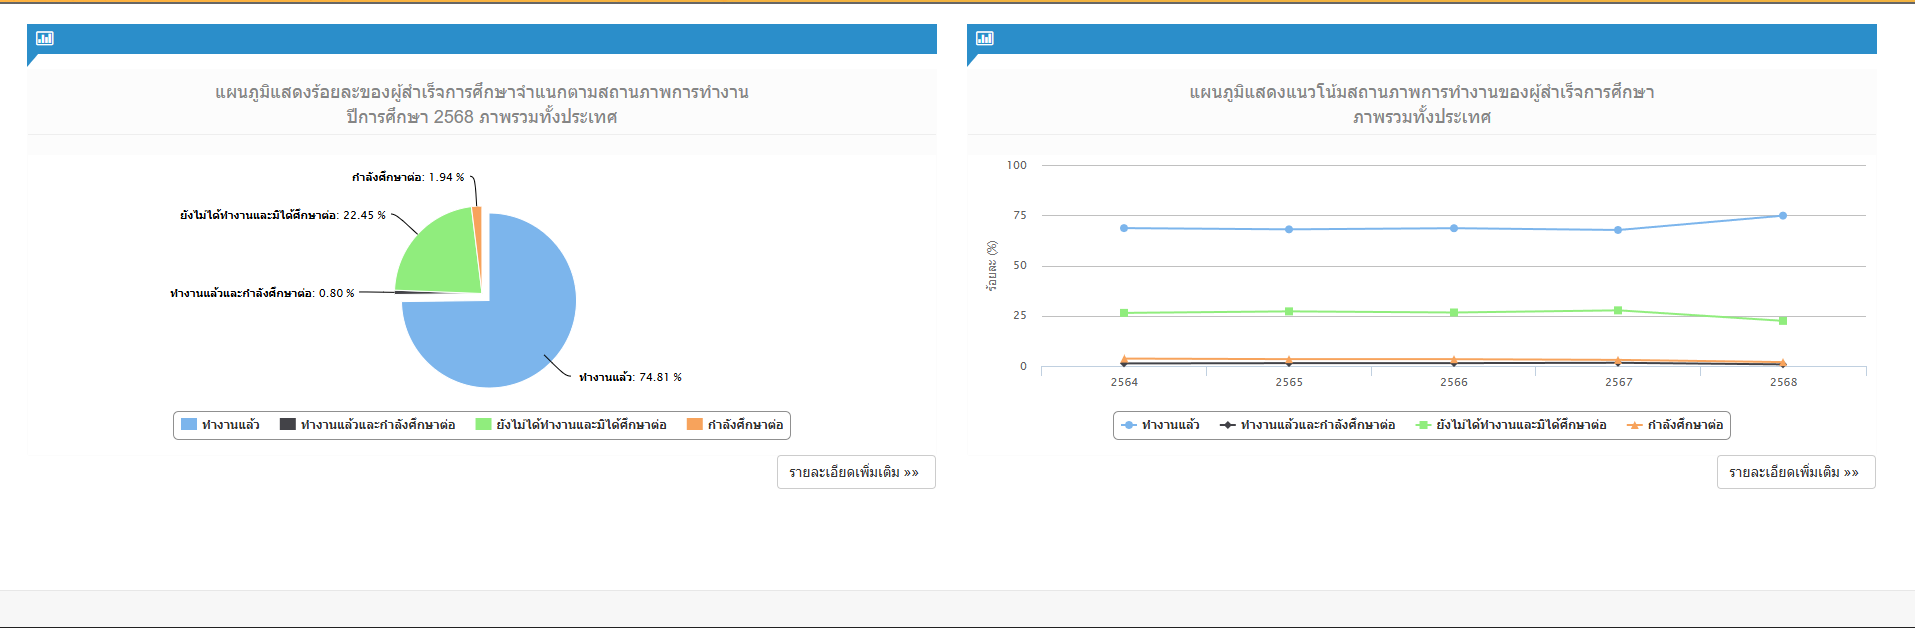
According to the pie chart, the employment status of graduates in Academic Year 2568 is as follows:
| Employment Status | Percentage |
|---|---|
| Employed | 74.81% |
| Employed and Continuing Education | 0.80% |
| Unemployed and Not Continuing Education | 22.45% |
| Continuing Education | 1.94% |
The data indicate that 74.81% of graduates are employed, demonstrating a relatively high graduate employment rate and strong labor market absorption.
Meanwhile, 22.45% of graduates are neither employed nor pursuing further education, representing approximately one-fifth of all graduates and constituting the group that requires the greatest attention.
Only 1.94% of graduates chose to continue their education, while 0.80% managed to combine employment with further study. These figures suggest that entering the workforce immediately after graduation remains the preferred pathway for most graduates.